Share this infographic
2020 Amended Budget Implementation Report
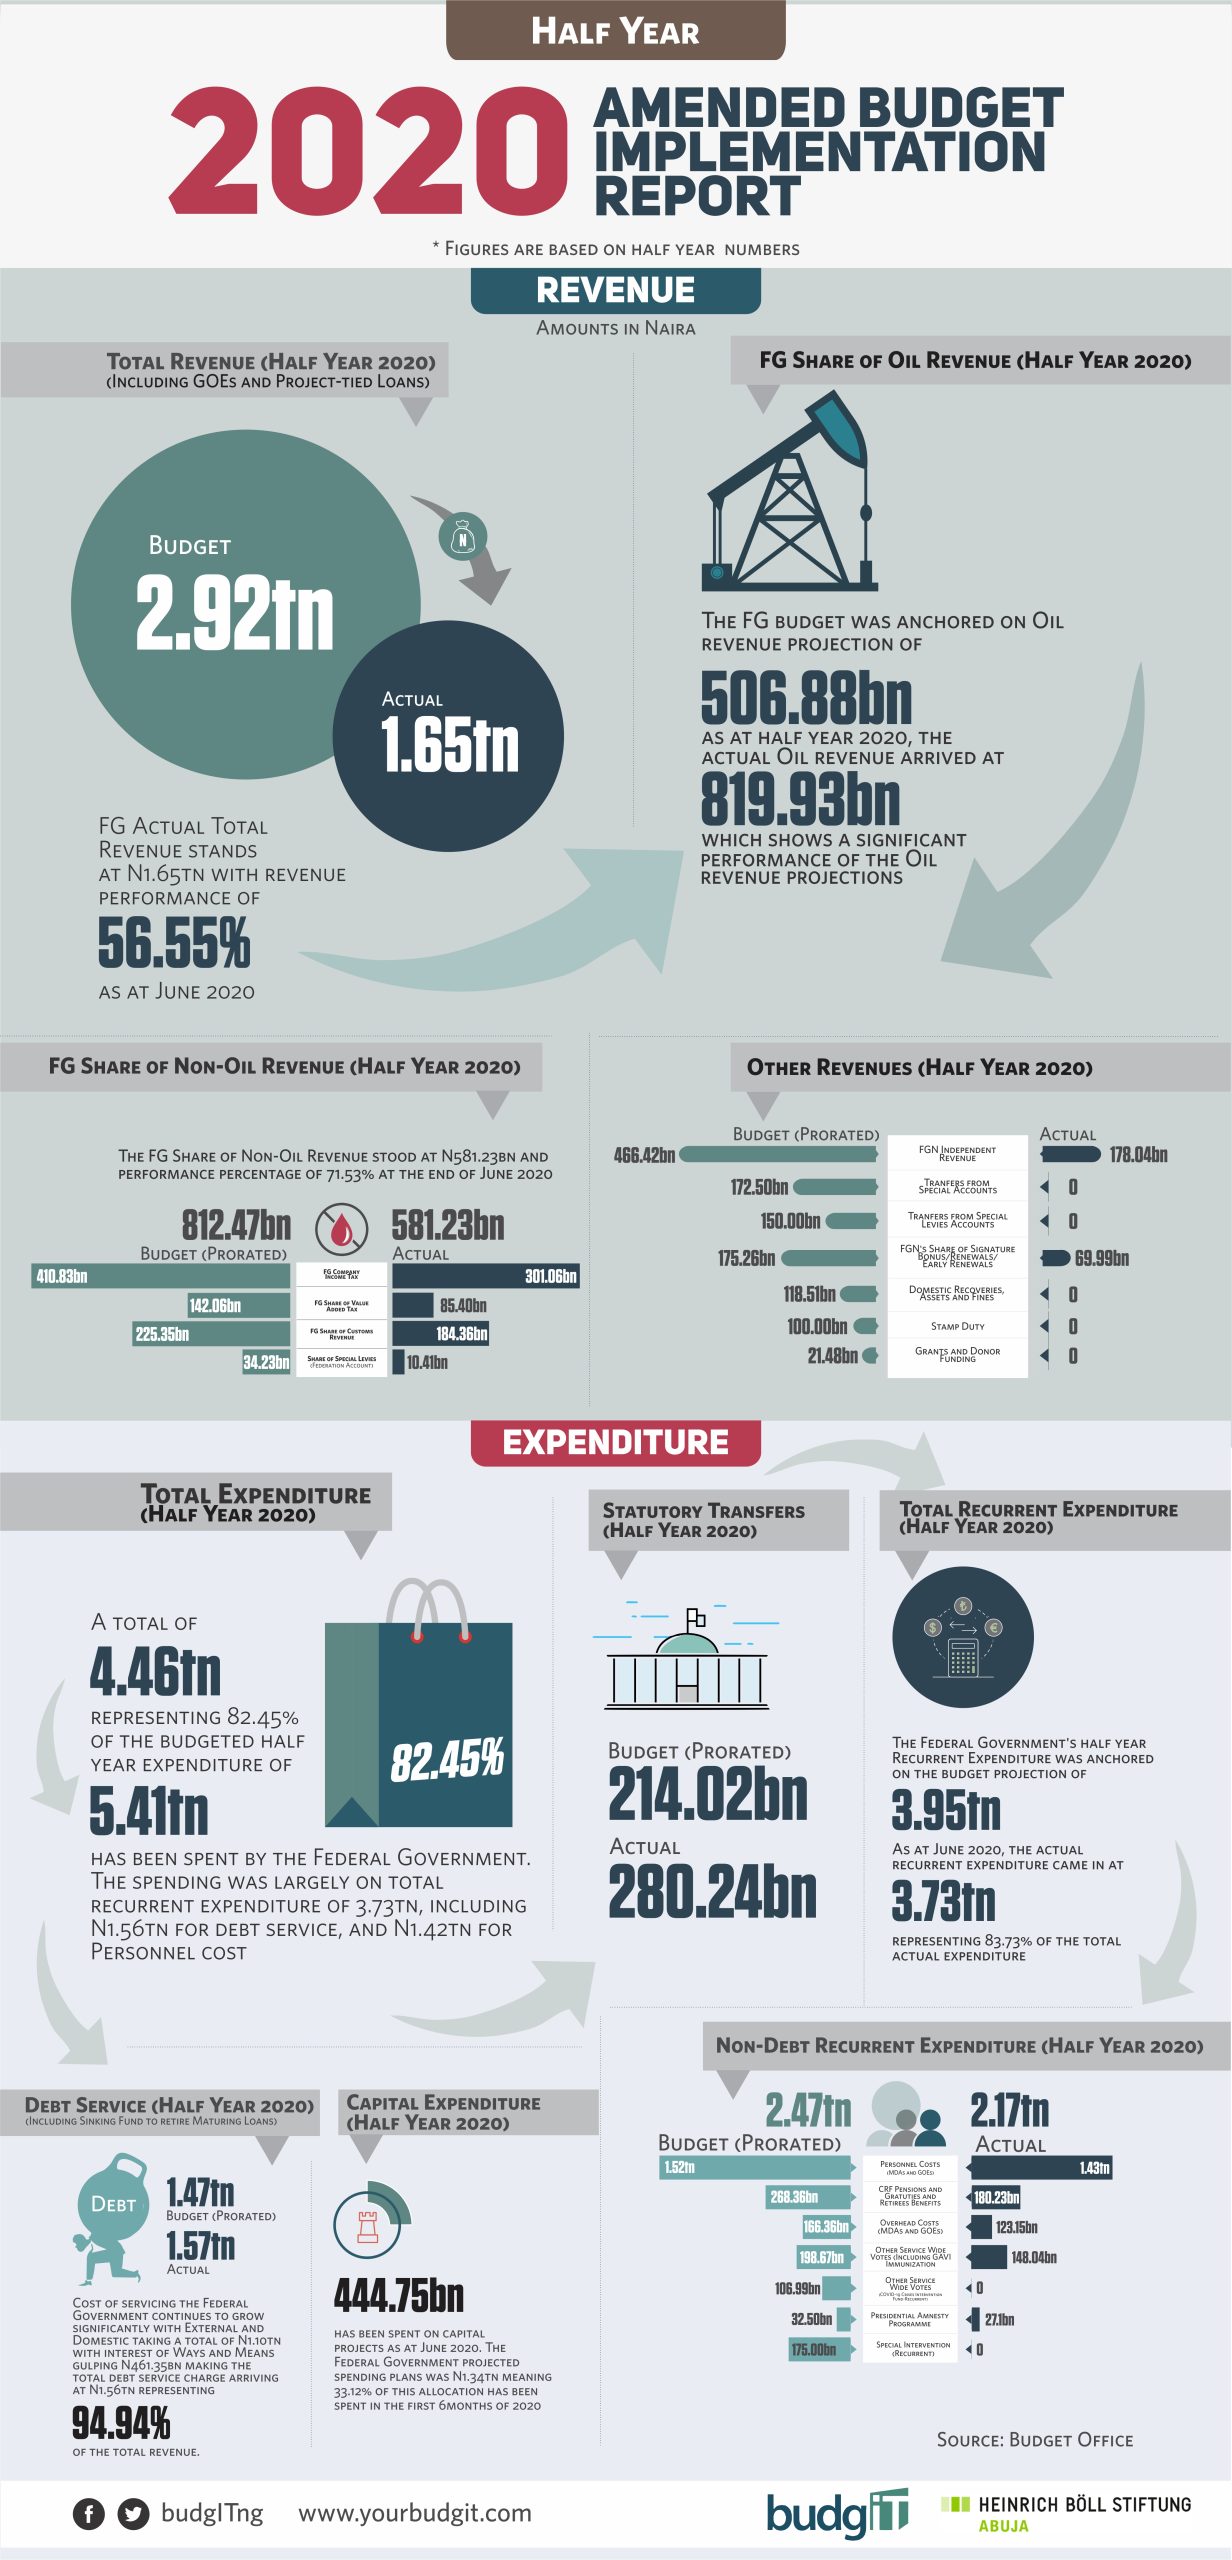
In the first half of 2020, debt servicing gulped 94% of the total revenue earned by the Nigerian government. Total expenditure was N4.46tn; this includes N3.7tn for recurrent expenditure, while only N444bn was spent on capital projects. Have a look at the breakdown of H1 2020 budget performance.
Explore Related Tags
The BudgIT “Infographics”, made available under the Creative Commons License CC BY-ND 3.0, may be used and displayed without charge by all commercial and non-commercial websites. Use is, however, only permitted with proper attribution to Budgit. When publishing one of these graphics, please include a backlink to the respective infographic URL.
Explore infographics from Other Countries