The 10th edition of BudgIT’s State of States marks the first time a state, Rivers, is excluded from the report. Following the President’s declaration of a State of Emergency in Rivers on March 18, 2025 (ratified March 20), the state was omitted from this year’s assessment. The state’s 2024 budget was ruled invalid as the legislature (the State House of Assembly) was excluded from the process. This exclusion affects overall subnational analysis, as Rivers typically ranks in the top five and significantly influences national fiscal metrics. The six-month emergency has since ended, and Rivers is expected to return in the 2026 edition.
Revenue Drive
The 2025 edition of the State of States report examines the revenue performance of Nigeria’s subnational governments, with a particular focus on Internally Generated Revenue (IGR). Overall, the total recurrent revenue of the 35 states assessed increased significantly, rising from N8.66tn in 2023 to N14.4tn in 2024, signifying a 66.28% growth, far surpassing the previous year’s 28.95% increase. Lagos maintained its lead as the highest earner but saw its share of total subnational recurrent revenue decline from 14.32% in 2023 to 13.42% in 2024, amounting to about N1.93tn. In 2023, 32 states relied on FAAC (Federation Account Allocation Committee) for at least 55% of their revenue, while 14 relied on it for 70% or more. In 2024, these figures shifted to 28 and 21 states, respectively. This means that a growing number of states remain heavily dependent on federation transfers for their revenue.
Between 2015 and 2024, subnational IGR growth showed notable variation. Borno and Ogun nominally recorded the highest increases at 862.61% and 463.47%, respectively. Ten states achieved growth above 500%, reflecting substantial improvement over the decade, while 30 states overall recorded at least a 200% rise in their internally generated revenue. The top-performing states have remained consistent over the years. From 2015 to 2024, Lagos and Rivers never left the top five, joined intermittently by Delta, Ogun, Kaduna, Kano, Enugu, and Edo. These states are major economic hubs with strong human and industrial capital. Their sustained performance indicates both their current economic dominance and their ability to further expand revenue generation in the years ahead.
Expenditures
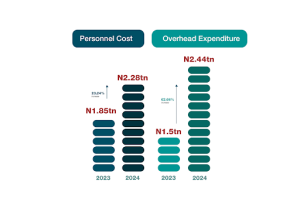
In the 2024 fiscal year, the subnationals collectively spent N15.63tn, representing a 64.69% increase from N9.49tn in 2023. Lagos State remained the largest spender with N2.37tn, about 14.95% of total subnational expenditure. When disaggregated, personnel costs increased by 23.24%, moving from N1.85tn in 2023 to N2.28tn in 2024, although three states recorded declines. Overhead expenditures increased by 62.66%, rising from N1.5tn to N2.44tn, with Lagos leading, while states like Abia, Bayelsa, Imo, and Ondo reduced their overhead costs. In terms of capital expenditure, all increased their capital spending except for Ondo state. Total capex moved from N4.06tn in 2023 to N7.63tn in 2024, marking an 87.93% rise. Notably, in 2024, capital expenditure exceeded recurrent expenditure by about N1.26tn, unlike in 2023, where operating costs exceeded capex by N600bn.
Looking at two major sectors, education and health, states budgeted N2.41tn but spent N1.61tn in the education sector in 2024, achieving a 66.9% implementation rate. Only nine states (Edo, Delta, Katsina, Rivers, Yobe, Ekiti, Bayelsa, Bauchi and Osun) exceeded 80% implementation. However, per capita spending averaged only N6,981, no state exceeded N20,000 per person, and only 8 states spent more than N10,000 per person. For health, the states budgeted N1.32tn but spent N816.64bn, indicating 61.9% performance. Only seven states (Yobe, Gombe, Ekiti, Lagos, Edo, Delta and Bauchi) achieved over 80% budget execution. However, despite Yobe’s high performance rate (98.2%), its total health expenditure was just N13.24bn, ranking 24th nationwide. Health spending per capita averaged a mere N3,483, with only seven states exceeding N5,000 per person and none surpassing N10,000.
Debt Management
Unlike revenue and expenditure trends, subnational debt management in 2024 showed a marked slowdown in growth. Total subnational debt rose modestly by 6.8%, from N9.89tn in 2023 to N10.57tn in 2024, far below the 36.4% increment recorded between 2022 and 2023. The five most-indebted states (Lagos, Kaduna, Edo, Ogun, and Bauchi) collectively owed N5.32tn, exceeding the combined debt of the remaining 25 states (N5.25tn). The debt of the top 5 debtors accounted for about 50.32% of the total debt of the entire subnationals. There was a significant improvement in domestic debt. While only 15 states reduced their domestic debt between 2022 and 2023, 31 states recorded reductions between 2023 and 2024, each exceeding N10bn. Lagos, Cross River, and Delta states reduced their debts by over N100bn each; cumulatively, the total domestic debt declined by over N2tn. Between 2023 and 2024, 22 states reduced their foreign debt by over $200mn. Lagos, Enugu, and Gombe had the highest reduction of $74.56mn, $33.39mn, and $21.88mn, respectively. Despite this, Lagos remained the most indebted state in foreign currency, at $1.17bn (over 25% of total subnational foreign debt), followed by Kaduna ($625.10mn) and Edo ($383.05mn). In 2024, 24 states had foreign debt exceeding 50% of total debt, with eight exceeding 80%. Average debt per capita was N41,766 in 2024, twelve states exceeded this average, with Lagos and Edo surpassing N100,000 per capita.
Call to Action
The State of States report evaluates subnational growth, fiscal management, and governance, promoting accountability and efficient, prudent, and effective administration for citizens’ benefit. However, the report is not without limitations and challenges. The methodology used focused more on the available fiscal space after obligations and equates higher capital spending with progress, while it ignores the efficiency and impact of capital expenditure, disregards expenditure quality, project effectiveness and long-term socio-economic outcomes. Hence, the methodology used in analysing the performance of states will be reviewed going forward to ensure that we not only measure the fiscal health of states, but also measure the quality of service delivery that states are embarking on.